seasonality, phenology, and evolutionary biogeography
Seasonality is a fundamental feature of Earth. It controls the annual rhythms, or phenologies, of countless species and ecological processes. It is a basic concept across so many fields of study, from ecophysiology and agriculture to community ecology and carbon cycling. Thus, it can be surprising how poorly we understand seasonal phenology across much of the planet. Fieldwork is costly and difficult, so is geographically limited, but remote sensing, using satellite imagery, offers a game-changing alternative. Yet satellite-based insight into phenology remains limited by methods that were developed for temperate, northern-hemisphere biomes and are inadequate for much of the rest of the world. My work is changing this.
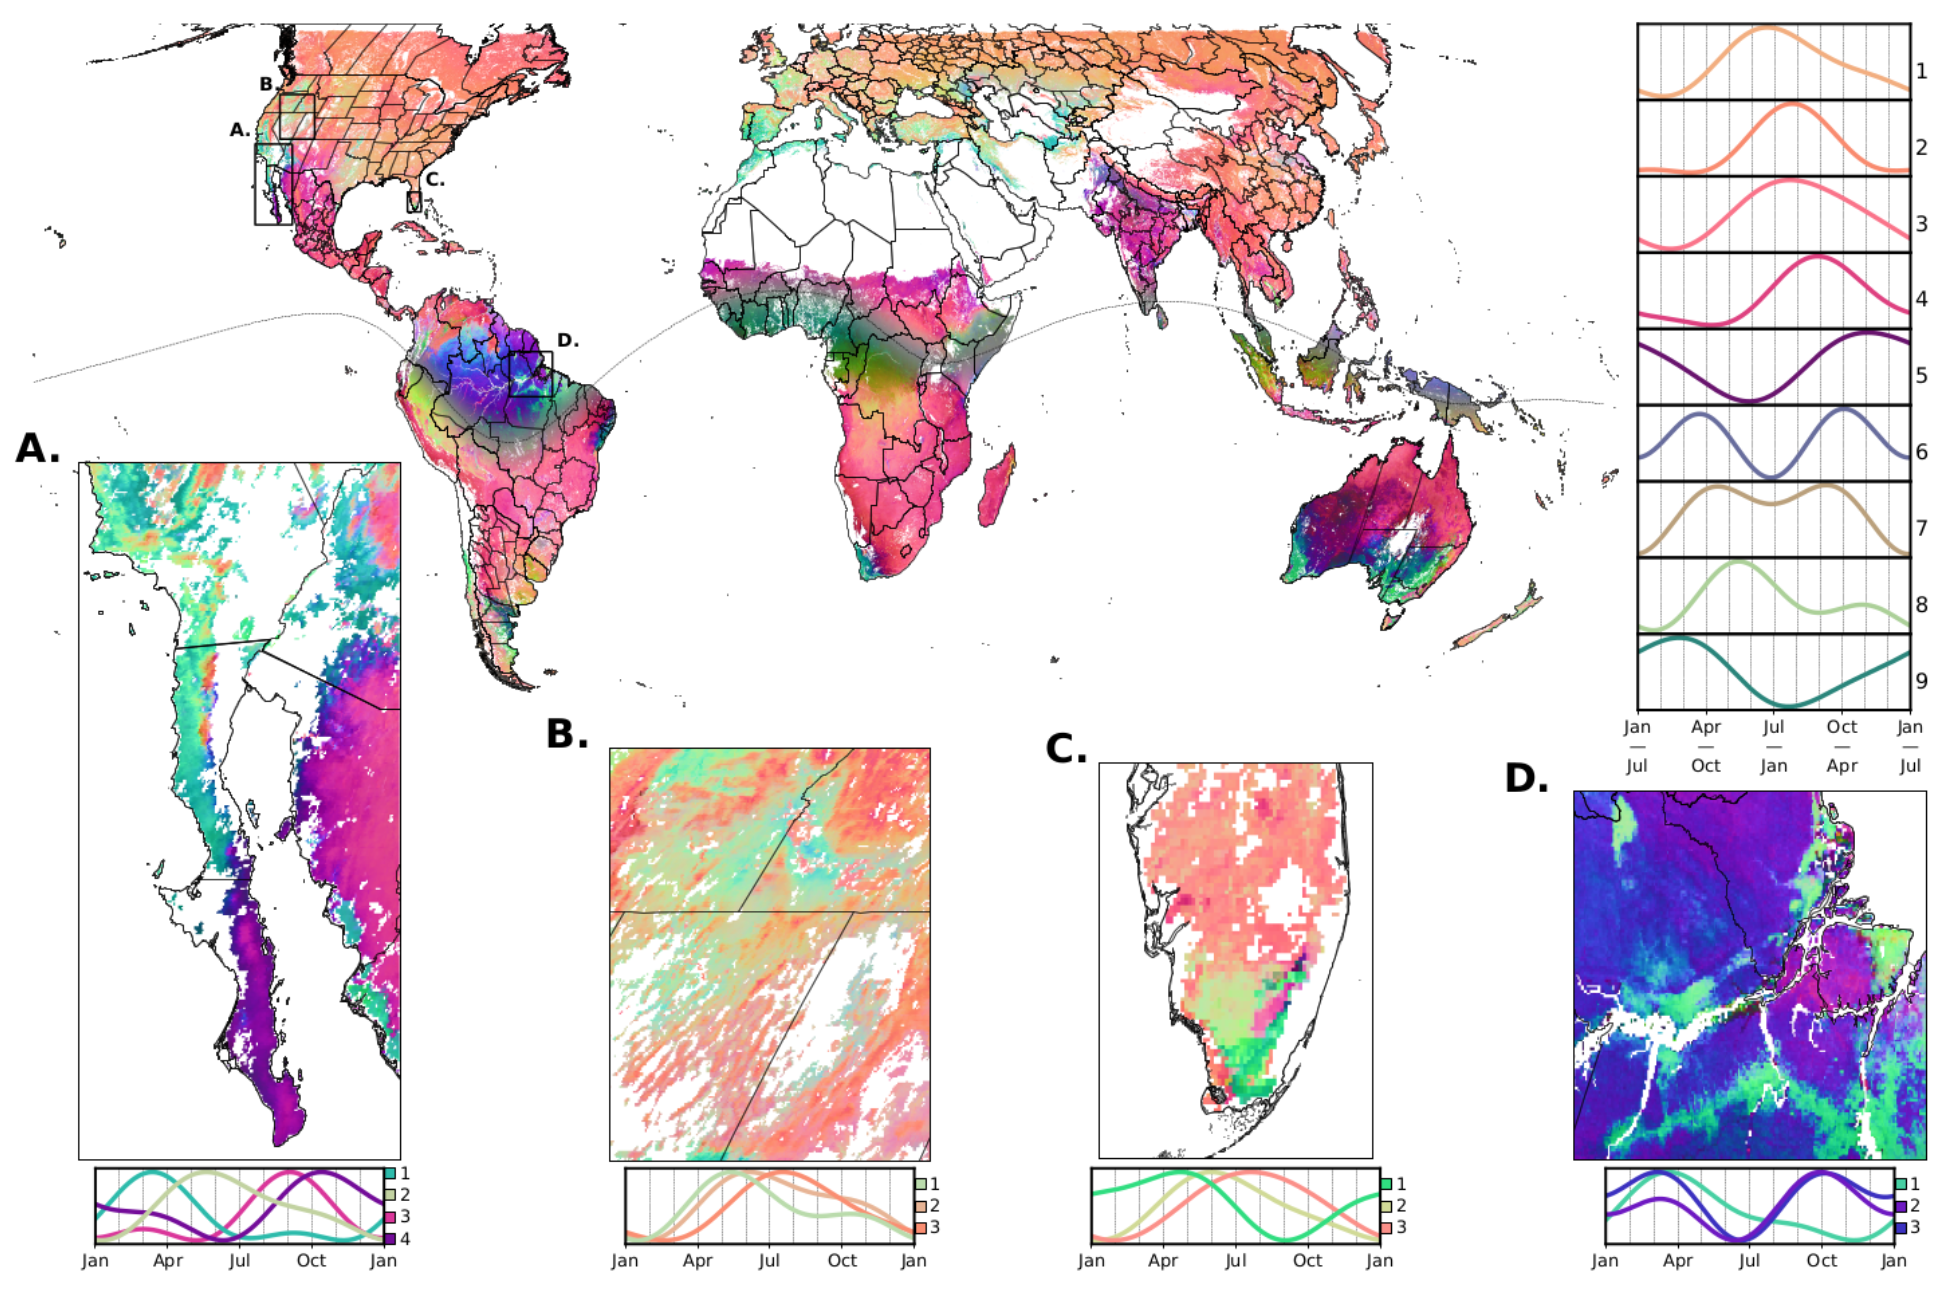
Global phenology map, derived from MODIS satellite imagery, showing intercontinental convergence in complex regional patterns. The more different the colors between any two spots on the globe, the more different the shape and timing of their average seasonal phenological cycles. Clusters 1 to 9 show the seasonal cycles associated with the most common colors in the global map. Inlaid maps give a closer look at the complex geographic variation in seasonal timing within regions of interest. For more detail, see the paper)
I first became interested phenology – the study of the timing of ecological processes such flowering, leaf-fall, migration, and so forth – when I was working in Central American cloud forests and I noticed that nearby sites within ‘the same forest type’ had populations of the same plant species that were at very different points in the life cycles (perhaps because of different seasonal timing of the complex cloud-immersion regimes that are so important in these regions?). I became totally fascinated with phenology when I learned about the intriguing but little-tested Asynchrony of Seasons Hypothesis, which I summarize as follows:
- 1.) the timing of seasonal patterns could vary across complex landscapes (e.g., different timing of the rainy season on different sides of a tropical mountain range);
- 2.) this could cause the phenologies of the species that cue into those patterns to also vary across the landscape;
- 3.) such ‘phenological asynchrony’ would cause populations of a species to be reproductively and thus genetically isolated (because any migrants between populations would typically have out-of-sync breeding schedules, so would fail to transfer their genes);
- 4.) regions where such ‘allochrony by allopatry’ is more common should have quicker rates of population genetic differentiation, and thus higher rates of formation of new species (potentially explaining global patterns of species diversity that have fascinated biogeographers for centuries – e.g., why is species diversity so crazy in tropical mountains!?).
I dove into the deep end in the third chapter of my PhD. Using 20 years of global satellite imagery of ecosystem function (essentially, space-based daily photos of plant growth across the Earth’s surface), I devised a method for calculating average seasonal phenologies around the world. This produces an intimate and unprecedented portrait of Earth’s terrestrial phenological diversity (shown above; you can interactively explore this map using our data viewer!). I then map the global pattern and drivers of phenological asynchrony (finding hotspots predominantly clustered in tropical montane regions and Mediterranean climates, predominantly driven by seasonal asynchrony in precipitation and minimum temperatures); document a latitudinal gradient in ‘isoclimatic phenological asynchrony’ (i.e., climatically similar sites are more likely to be out-of-sync in the tropics, increasing the likelihood that the same species could be found in both and thus could be evolutionarily affected); and show that our space-based maps predict on-the-ground patterns of allochrony by allopatry and genetic divergence across a range of species and across global hotspots of phenological asynchrony. This work was featured on the cover of Nature. It offers numerous avenues for promising research that I am excited to explore.
landscape genetics, global change, and simulation
The future of biodiversity depends, in part, on the dynamics and effectiveness of evolutionary responses to global change. Predicting these responses requires understanding a wildly complex system: the population genomics of species that are unevenly distributed across changing landscapes. This challenge is compounded by the large spatial scales and timespans at which the dynamics we are interested in often play out.
Simulation is a critical tool for insight into complex systems, but landscape genomics tools are scarce. Thus, I developed Geonomics, a flexible, user-friendly Python package for simulating landscape genomics. (Think of a simulator as a video game, but without all the fun bits.) We published a paper Molecular Biology and Evolution that describes, validates, and demonstrates the model. The conceptual diagram below gives a high-level sense of how the software works, and this talk from the 2022 Evolution conference offers a quick tutorial.
(NOTE: I’m always happy to chat with and support potential users, so do get in touch!)
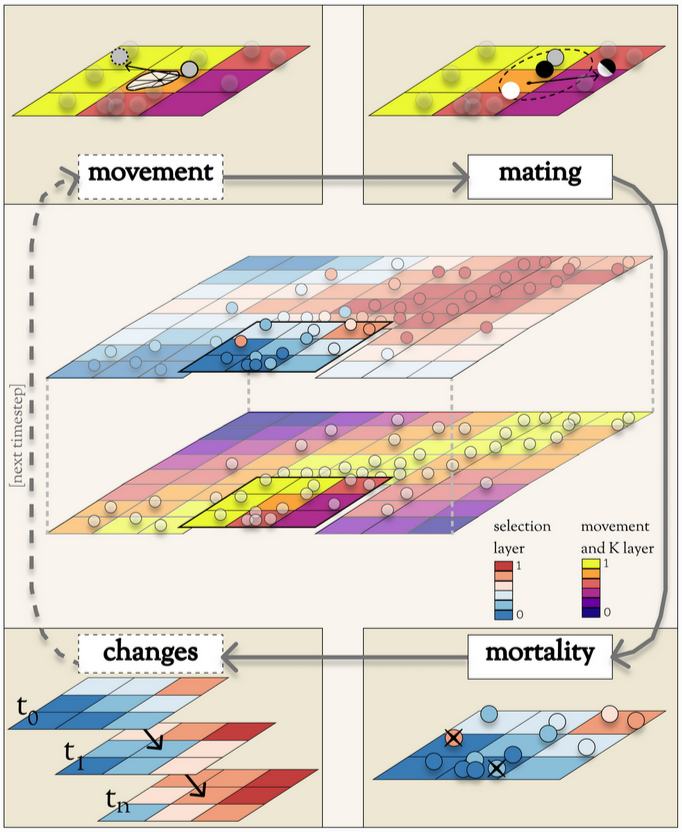
Conceptual diagram showing how Geonomics is strucutred and what it does. The model simulates individuals (here shown as spheres) of a species, distributed across a landscape, and each carrying its own genome. The landscape is defined as a stack of raster grids representing important environmental factors. Some environmental factors can exert natural selection on individuals’ traits, such as the top landscape grid shown here. Others can influence the carrying capacity (i.e., local population size) and/or movement behavior of the species, such as the bottom grid shown here. The model simulates any number of time steps, during which individuals can move (shown here in the top left corner); individuals can find mates, combine their genes and reproduce, and disperse offspring (top right); individuals can die from natural selection and/or density dependence (bottom right); then the environment could be programmed to change (bottom left). After enough time steps of a model, spatial patterns of genetic diversity build up. We can use those patterns to explore how landscape genetics likely works on real landscapes and to make inferences about the processes likely driving patterns we observe in real-world data.
I built Geonomics to study an otherwise intractable question: How do species’ evolutionary responses to climate change depend on the number and organization of the genes that control their climate-adapted traits? Climate change can change the geographic patterns of different environmental factors (e.g., temperature versus precipitation) in different ways, shifting the optimum trait combinations that occur across a landscape (as shown in the conceptual diagram below) and thus driving complex evolutionary changes that software such as Geonomics is ideally suited to understand. My findings suggest that genomic architecture – that is, the number and physical arrangement of genes within the genome – could control adaptation to climate change in ways that are important for efforts to manage genetic diversity. This poses the challenging question of how best to determine or predict the genomic architecture of relevant traits in real species of conservation concern. We published this work in Global Change Biology.
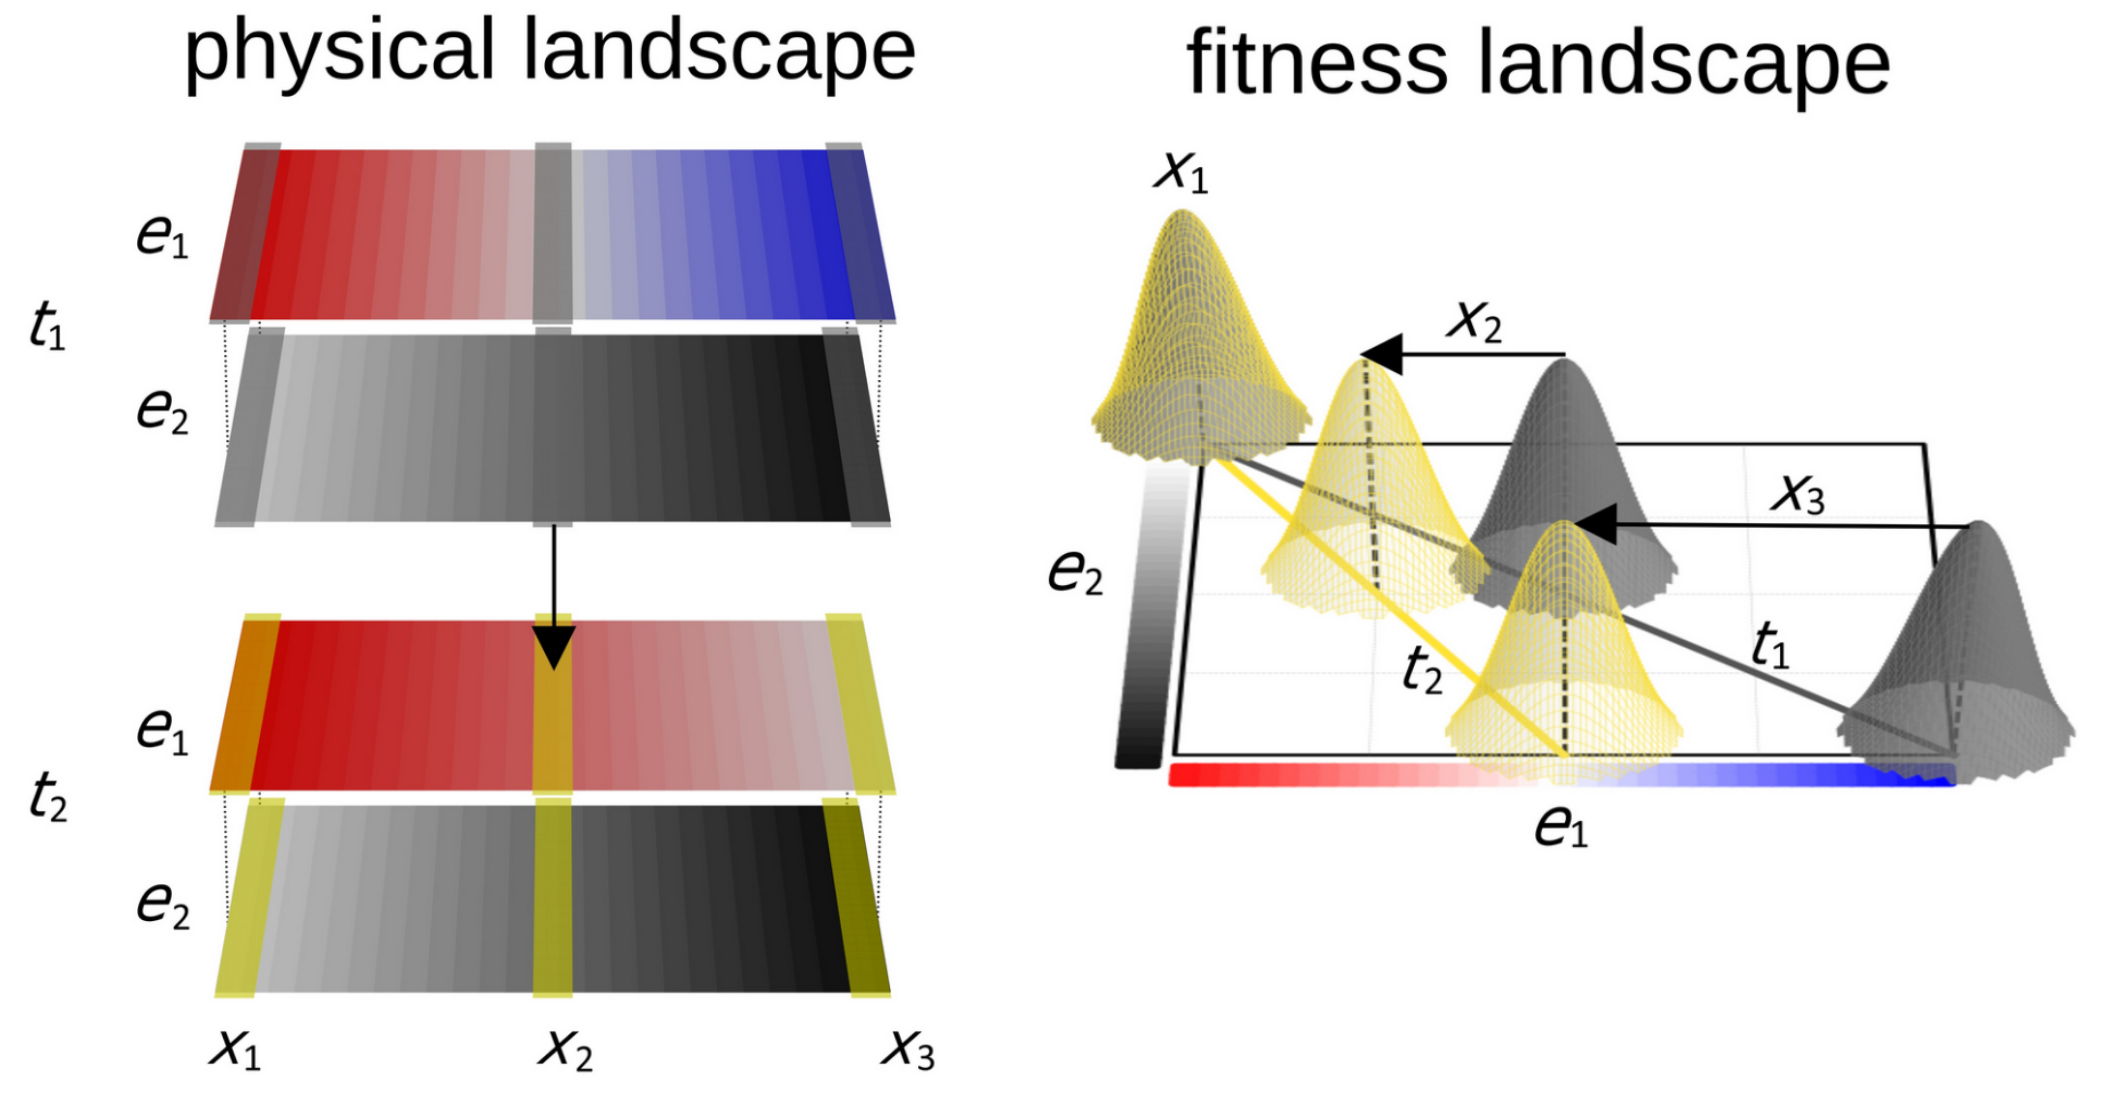
Our conceptual framework for simulation of adaptation to climate change. Between times t1 and t2, one environmental gradient (e1) on the physical landscape (left) shifts at a different rate than does the other (e2). This causes novel environments to emerge at various geographic locations (x1,2,3), shifting adaptive peaks across the fitness landscape (right).
land use, biodiversity, and conservation
We are overhauling the biosphere faster than we can understand it. I have a vested interest in its future. I address this concern through applied research in conservation and global change ecology, delivering targeted insight to support land management.
Some of this work has focused on agroforestry. Agroforestry, in short, is the practice of growing trees and non-tree agricultural products on the same piece of land. It’s really just a highfalutin term for how much of agriculture has probably looked in most places and societies, for thousands of years. But tree cover has become less common across much of the world’s agricultural lands, not least because of the tendency of modern agricultural practices to plow ‘fencerow to fencerow’ in the obsessive pursuit of productivity and profit. The environmental costs of this approach to making food and fiber, though still largely economically externalized, will be news to nobody – soil erosion, biodiversity loss, food insecurity, water pollution, climate change, and the like. The good news is that adoption and expansion of agroforestry could work to counter these trends. Agroforestry systems are multifunctional ecosystems that can often provide numerous environmental and economic benefits (though not always! context is key!).
The potential benefits of agroforesty expansion include the potential to increase the sequestration, storage, and protection of carbon on agricultural land – that is, to serve as a ‘natural climate solution’ (NCS). This is an area of growing interest in policy and practice, but one that has received relatively less attention in prior agroforestry science work. Thus, my colleagues at The Nature Conservancy and elsewhere have initiated a global effort to gather, organize, and analyze all of the available data on carbon in agroforestry systems, to better understand the quantity and context of the potential of agroforestry as an NCS. The first step in this process was a global pulse-check on the state of the science, which we published in Nature Climate Change (including the conceptual diagram below, which helps frame out a definition of agroforestry as an NCS). This a major and ongoing effort with numerous avenues of forthcoming work.
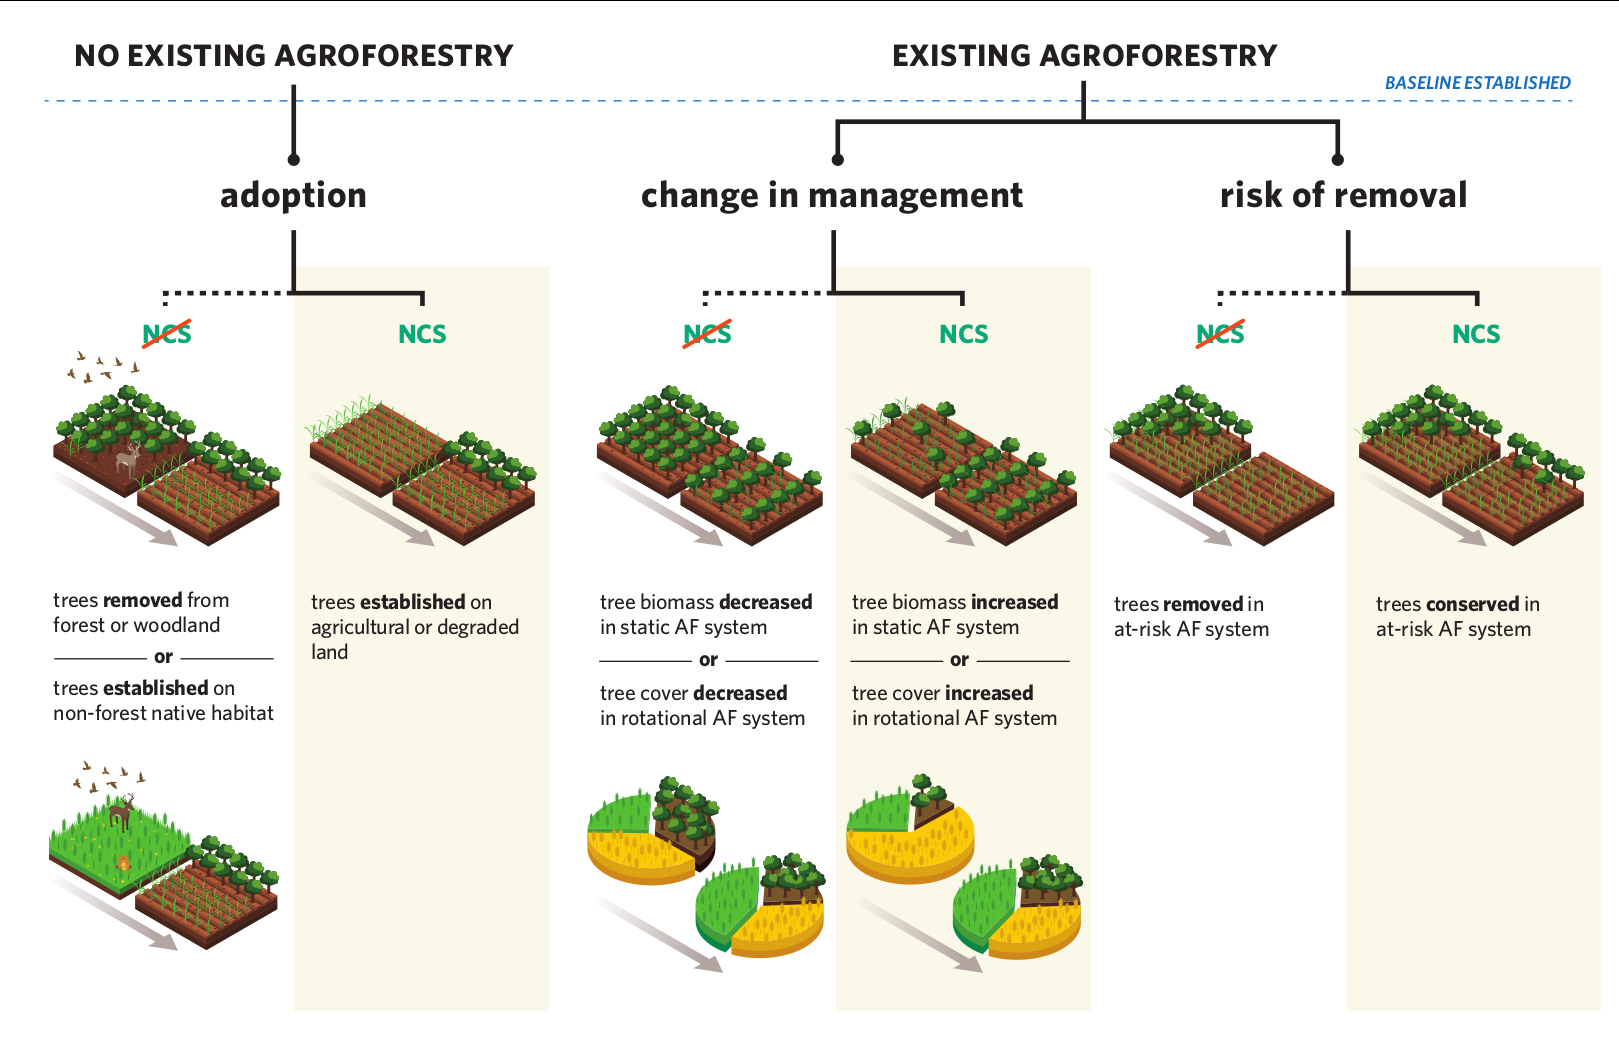
A first-approximation framework for determining when agroforestry is a climate solution. Agroforestry is an NCS when it is adopted after a carbon-accounting baseline and does not have net-negative biodiversity impact (left), when a change in management increases its spatially or temporally averaged carbon storage (center), or when action is taken to preserve it despite risk of clearance (right). (Graphic design by me, production by Vin Reed.)
I have been and remain involved in a number of other applied research projects, as well. All of this work aims to deliver national- and global-scale, data-driven insight for land management and species conservation. See the papers tab for more.